by Terri Calderone
Courtesy of TechBeacon
You have a new code release and two weeks for performance testing. What tests do you run?
One common answer is to run the same tests you used on the last release (after fixing your scripts, of course). This is a good way to make sure the new release can handle the same load as the last one. However, this approach ignores a key fact: loads change.
Performance testing and unexpected loads
A few years ago, I tested a reservation system for a resort. The customer was focused on meeting the previous-release goals for service-level agreements and throughput (as measured by business processes completed per hour). This did help us reduce response times and validate that the system could support the same load as the previous release. However, it didn’t prevent a large production outage.
The new code was developed in the midst of the Great Recession. Bookings at the resort were down, so the marketing team created an amazing deal: four nights for the price of three, with lots of freebies thrown in. The bargain unleashed a huge wave of customers looking for a cheap vacation. This perfect storm of great marketing, poor economy, and eager customers led to an unforeseen load and serious production downtime.
The temporary fix was to pull all the boxes from the performance testing environment into production until the sale was over. Performance testing was put on hold for weeks until the servers could be returned from production.
When we finally got the servers back, we tried to reproduce the event that occurred in production. This included a deep dive into production logs from that time frame to figure out what the traffic patterns were during the sale. What we found was a huge discrepancy in our load goals compared to actual production traffic patterns.
At this point our team realized the need to create user models for each application on a yearly basis. Let’s talk a little about user modeling and how you can incorporate it into the testing you do.
User modeling with UCML
At the start of my testing career, I spent a good bit of time filling out, reviewing, and explaining spreadsheets of user and throughput counts. I love spreadsheets and pivot tables, but they can be extremely hard to visualize.
I’ve been able to turn those spreadsheets into User Community Modeling Language (UCML) diagrams for use in test plans. These UCML diagrams are a fantastic way to describe system usage in a readable, digestible format.
I’m going to walk you through a simple example of making a UCML diagram using data from production logs. I’ll demonstrate how to use your knowledge of business process flows to calculate traffic patterns for steps where you lack data. Here’s how:
- Identify the busiest hour and operation throughput for that hour
- Determine the business process steps needed to complete each operation in the UI
- Create a partial UCML diagram to verify you have all the steps needed
- Put all steps into a table and enter throughput data for each operation
- Calculate the missing throughput for the additional steps required for each operation
- Calculate the UCML percentages and fill in your diagram
For the resort reservation system, I started with the following data for the busiest hour:
Operation | Source | Throughput (per Hour) |
retrieveReservation | (from logs) | 524 |
getOffer | (from logs) | 2,545 |
bookReservation | (from logs) | 268 |
modifyReservation | (from logs) | 85 |
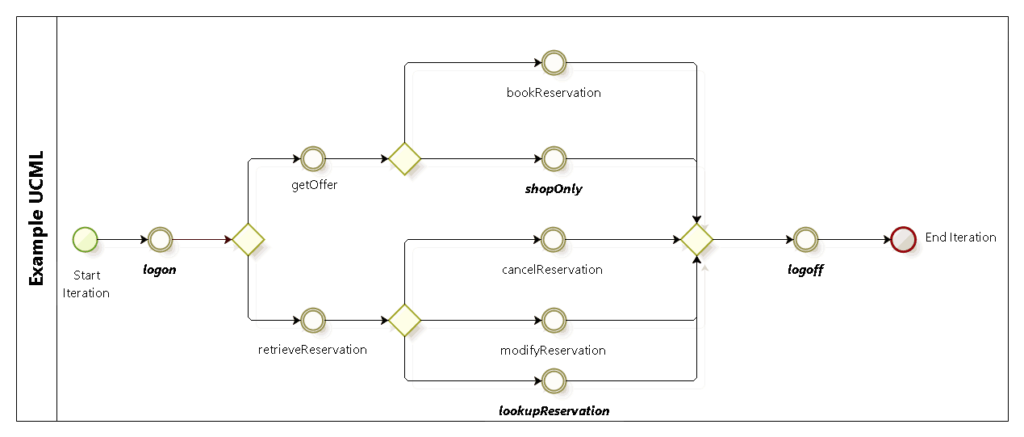
Next, I created a UCML graph to determine the additional steps needed to complete each operation in the UI. These include users logging on and off the application, looking up a reservation without modifying or canceling it, and shoppers getting an offer without booking:

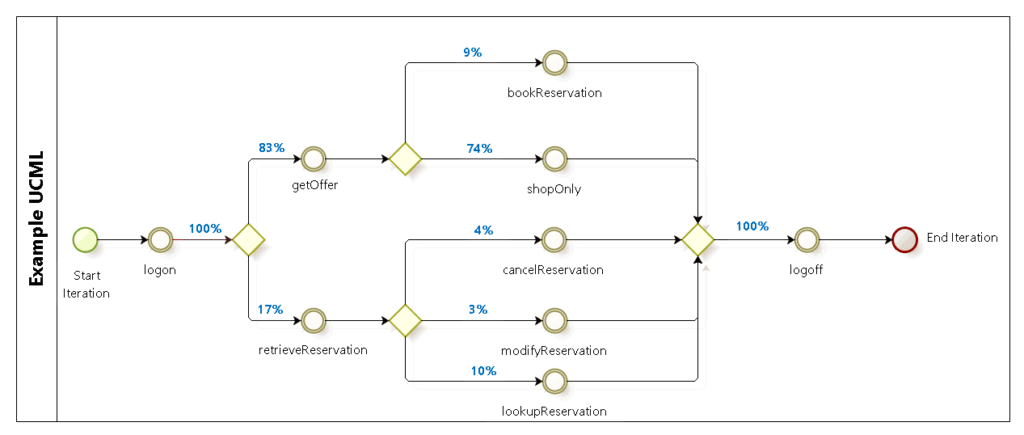
When building the UCML model, you need to take into account those additional steps when designing and calculating the percentage of users at each step. To complete the model, I plugged the additional steps into my table and calculated the traffic for these new steps, as shown in italics below. The UCML percentages were calculated by comparing the throughput of each step to the total throughput of its parent step. For example, the retrieveReservation and getOffer operations add up to the parent step of login.
Operation | Source | Throughput (per Hour) | UCML Percentage |
login | = retrieveReservation + getOffer | 3,069 | 100% |
retrieveReservation | (from logs) | 524 | 17% |
getOffer | (from logs) | 2,545 | 83% |
bookReservation | (from logs) | 268 | 9% |
shopOnly | = getOffer – bookRes | 2,277 | 74% |
cancelReservation | (from logs) | 128 | 4% |
modifyReservation | (from logs) | 85 | 3% |
lookupReservation | = retrieveReservation – cancelRes – modifyRes | 311 | 10% |
logoff | = login | 3,069 | 100% |
I then plugged these percentages into the graph to complete the UCML model:

This UCML model is the visual representation of the load model for performance testing. After creating your user model, review it with your team and the business to validate that everyone is on the same page.
Keep updating your user models
Phew, that wasn’t nearly as bad as you thought, right? But don’t stop here. Application user modeling isn’t a one-and-done activity. It’s vital to run statistics against your production logs frequently to validate that your tests are growing along with your user base.
At the very least, this analysis should be done on a yearly basis. Depending on the nature of your application, it can certainly be done more often. Build your user models, compare them to what you see in production, and be confident with the results you present to the business.